Data
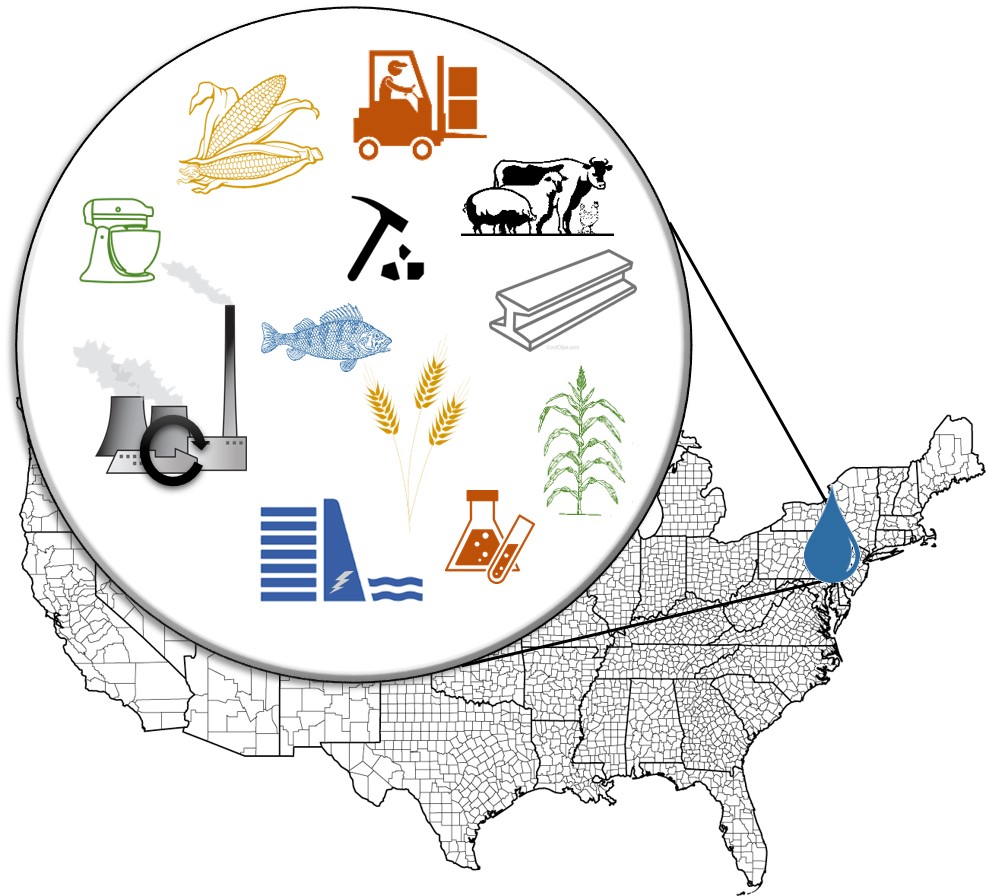
A rich dataset for the United States showing the water footprint of production per economic sector at state level and at county level (for some sectors), and distinguishing between surface water footprint and groundwater footprint. The different sectors included are crop production, livestock, aquaculture, mining, thermoelectric power production, and commercial, industrial, and institutional production. DATA FOUND HERE.
Reference: Marston, L., Y. Ao, M. Konar, M. Mekonnen, and A.Y. Hoekstra (2018), High-resolution water footprints of production of the United States, Water Resources Research, Vol 54, Issue 3, pp. 2288-2316, doi: 10.1002/2017WR021923.
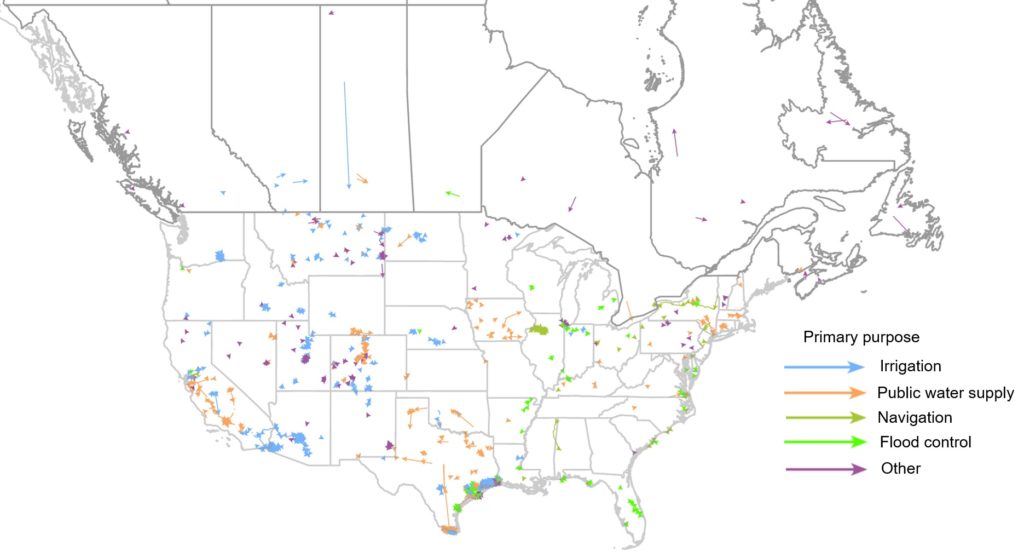
Interbasin water transfers (IBTs) can have a significant impact on the environment, water availability, and economies within the basins importing and exporting water, as well as basins downstream of these water transfers. The lack of comprehensive data identifying and describing IBTs inhibits understanding of the role IBTs play in supplying water for society, as well as their collective hydrologic impact. We develop three connected datasets inventorying IBTs in the United States and Canada, including their features, geospatial details, and water transfer volumes. We surveyed the academic and gray literature, as well as local, state, and federal water agencies, to collect, process, and verify IBTs in Canada and the United States. Our comprehensive IBT datasets represent all known transfers of raw water that cross subregion (US) or subdrainage area (CA) boundaries, characterizing a total of 641 IBT projects. The infrastructure-level data made available by these data products can be used to close water budgets, connect water supplies to water use, and better represent human impacts within hydrologic and ecosystem models. DATA FOUND HERE.
Reference: Siddik, M.A.B., Dickson, K.E., Rising, J., Ruddell, B. L., & Marston, L. T. (2023). Interbasin water transfers in the United States and Canada. Scientific Data, 10(1), 1-9. https://doi.org/10.1038/s41597-023-01935-4
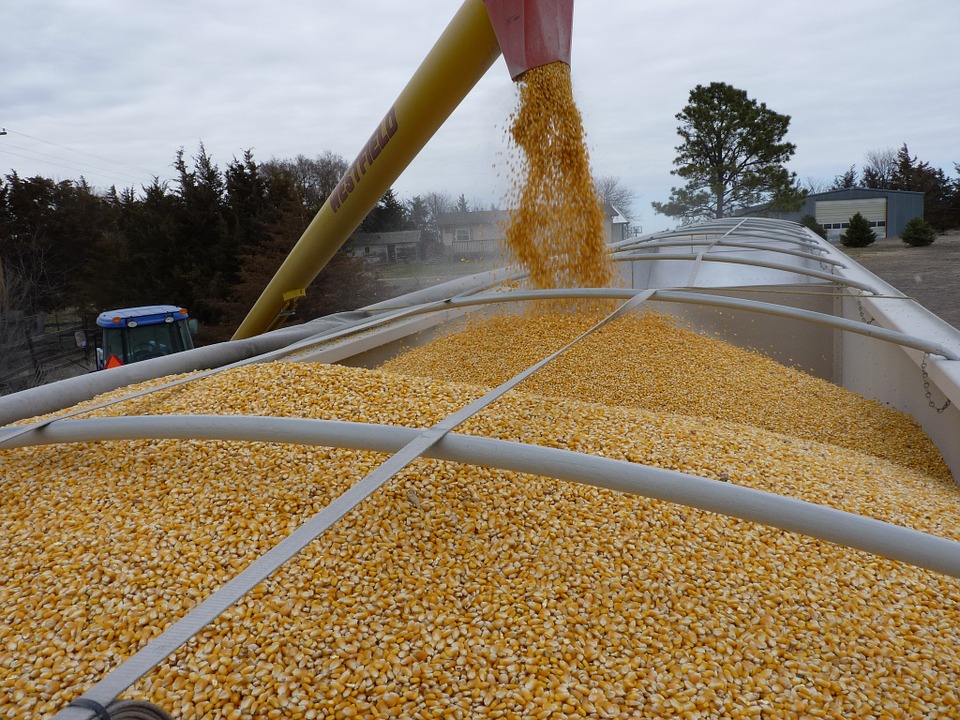
We developed the Food Flow Model, a data-driven methodology to estimate spatially explicit food flows for subnational locations without data. The Food Flow Model integrates machine learning, network properties, production and consumption statistics, mass balance constraints, and linear programming. We use the Food Flow Model to infer food flows between counties within the United States. Specifically, we downscale empirical information on food flows between 132 Freight Analysis Framework (FAF) locations (17,292 potential links) to the 3,142 counties and county-equivalents of the United States (9,869,022 potential links). Our subnational food flow estimates can be used to improve understanding of vulnerabilities within the national food supply chain and enable spatially detailed footprint assessments. DATA FOUND HERE.
Reference: Lin, X., P.J. Ruess, L. Marston, and M. Konar (2019) Food flows between counties in the United States, Environmental Research Letters, doi: 10.1088/1748-9326/ab29ae.
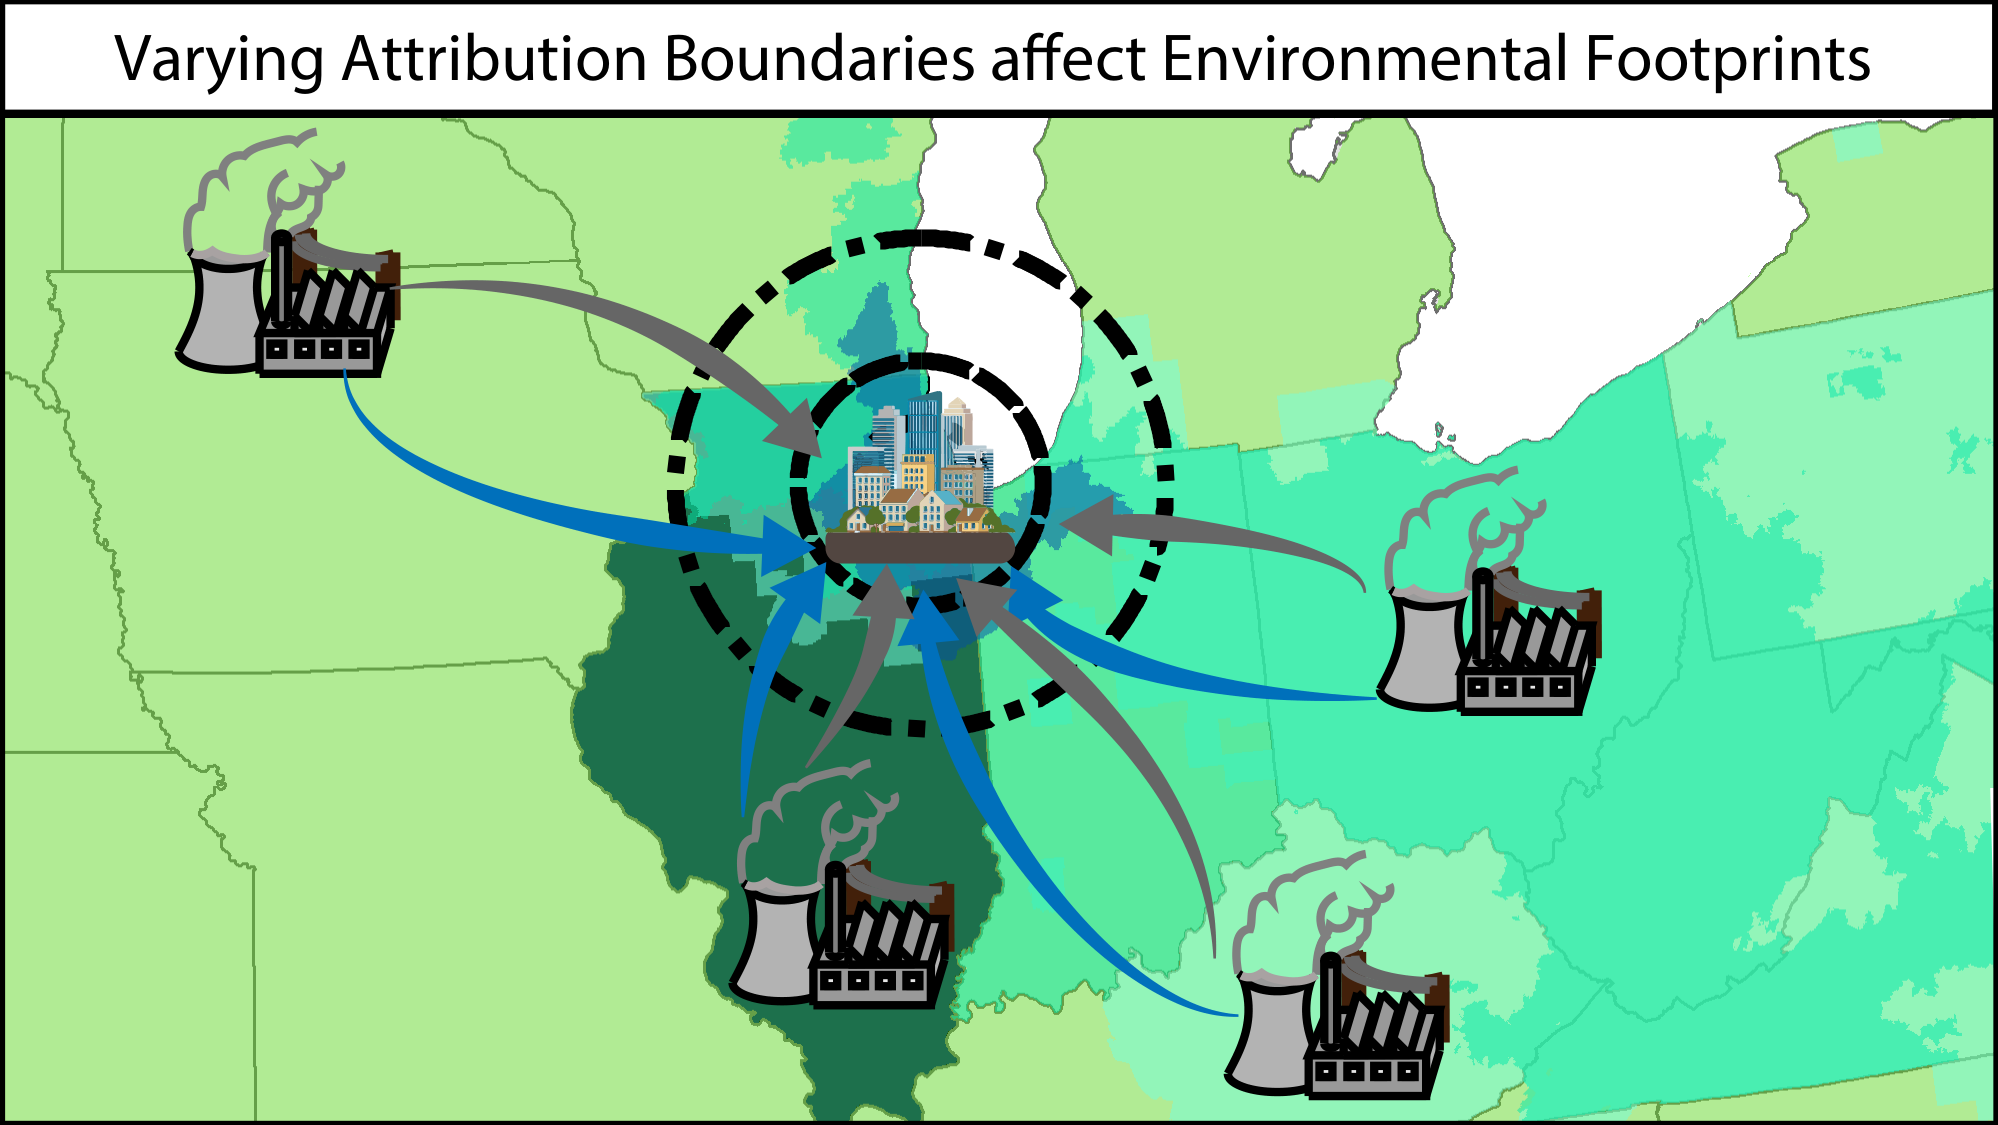
Though several methods have been developed to connect the environmental footprint of electricity generation to end users, estimates produced by these methods are inherently uncertain due to the impossibility of actually tracing electricity from the point of generation to utilization. Previous studies rarely quantify this uncertainty, even though it may fundamentally alter their findings and recommendations. Here, we evaluate the sensitivity of water and carbon footprints estimates among seven commonly used methods to attribute electricity production to end users. We assess how sensitive water and carbon electricity footprint estimates are to attribution method, how these estimates change over time, and the main factors contributing to the variability between methods. We evaluate and make available the water and carbon footprints of electricity consumption for every city across the contiguous United States for all assessed methods. The variation between attribution methods suggest future studies need to consider how the method selected to attribute environmental impacts through the electrical grid may affect their findings. DATA FOUND HERE.
Reference: M.A.B. Siddik, C.M. Chini, and L. Marston (2020). Water and carbon footprints of electricity are sensitive to geographical attribution method, Environmental Science & Technology, doi: 10.1021/acs.est.0c00176.
Copyright © 2023 by Landon Marston